Interface
Dashboard overview
Layout of the Eclipse dashboard: header, queue, and side panels.
The dashboard is the main window of Eclipse Render Manager. Everything you do (local queue, farm jobs, insights overlays, and settings) starts here.
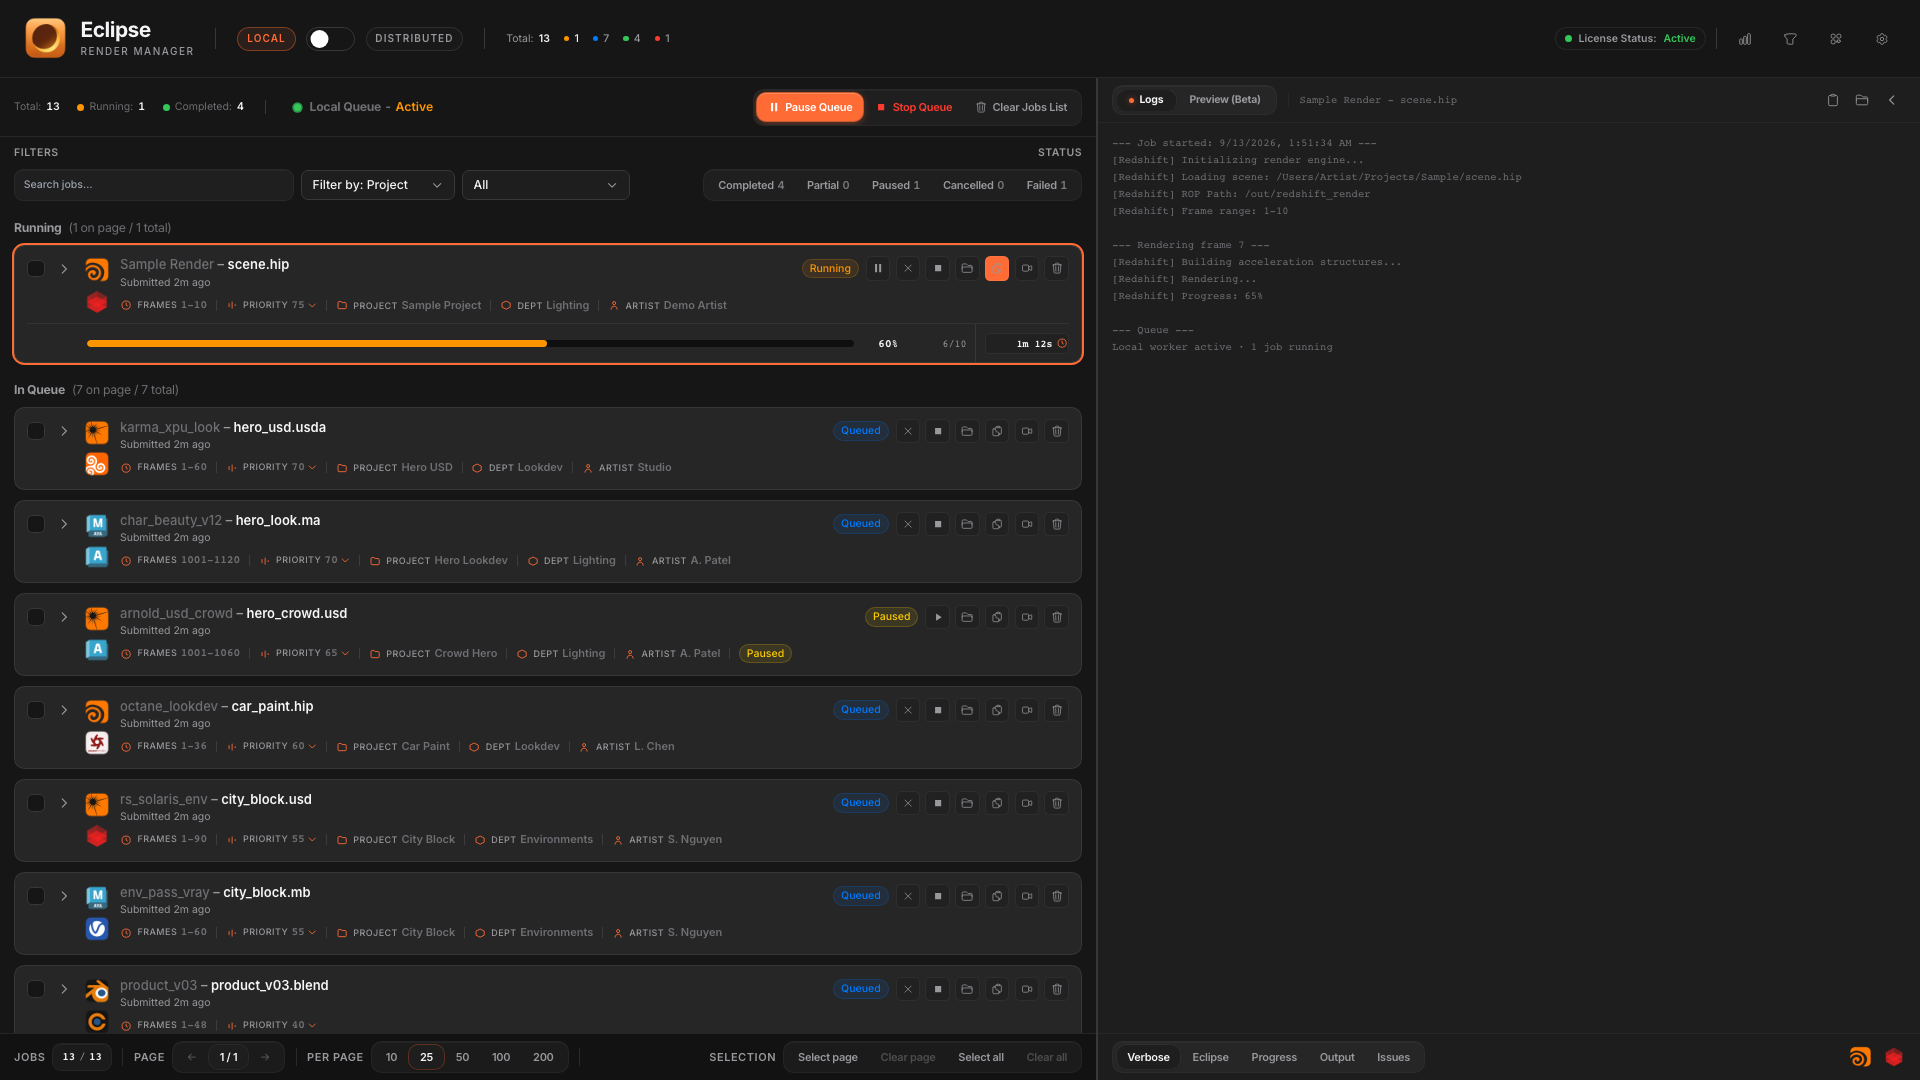
Header
- Brand and product name on the left.
- Local / Distributed toggle in the center.
- Queue summary stats (Total, Running, Completed, Paused, Failed) and license status.
- Shortcuts to Insights, Local capabilities, Integrations, and Settings.
Main area
In Local mode the main area is the job list grouped by status. In Distributed mode it becomes farm Jobs, Network Map, Projects, or related farm views depending on the selected tab.
Right panel
When a job is selected, the right panel shows Logs and Preview (Beta). You can hide the panel when you need a wider queue view, then reopen it from the job or panel chrome.
Related